¶ Monitoring Tenants and the Tenant Dashboard
This sub-module discusses the use of Dashboards and Subscriptions to oversee your Tenants and their activity. Dashboards will provide a lot of helpful information about Tenants. VergeIO Subscriptions can be configured to provide regularly scheduled Tenant reports and on-demand alerts upon various events, such as thresholds, errors, warnings, etc.
¶ Dashboards
The All-Tenants Dashboard (summary info all Tenants)
The Tenants Dashboard provides summary information about all the Tenants in a system.
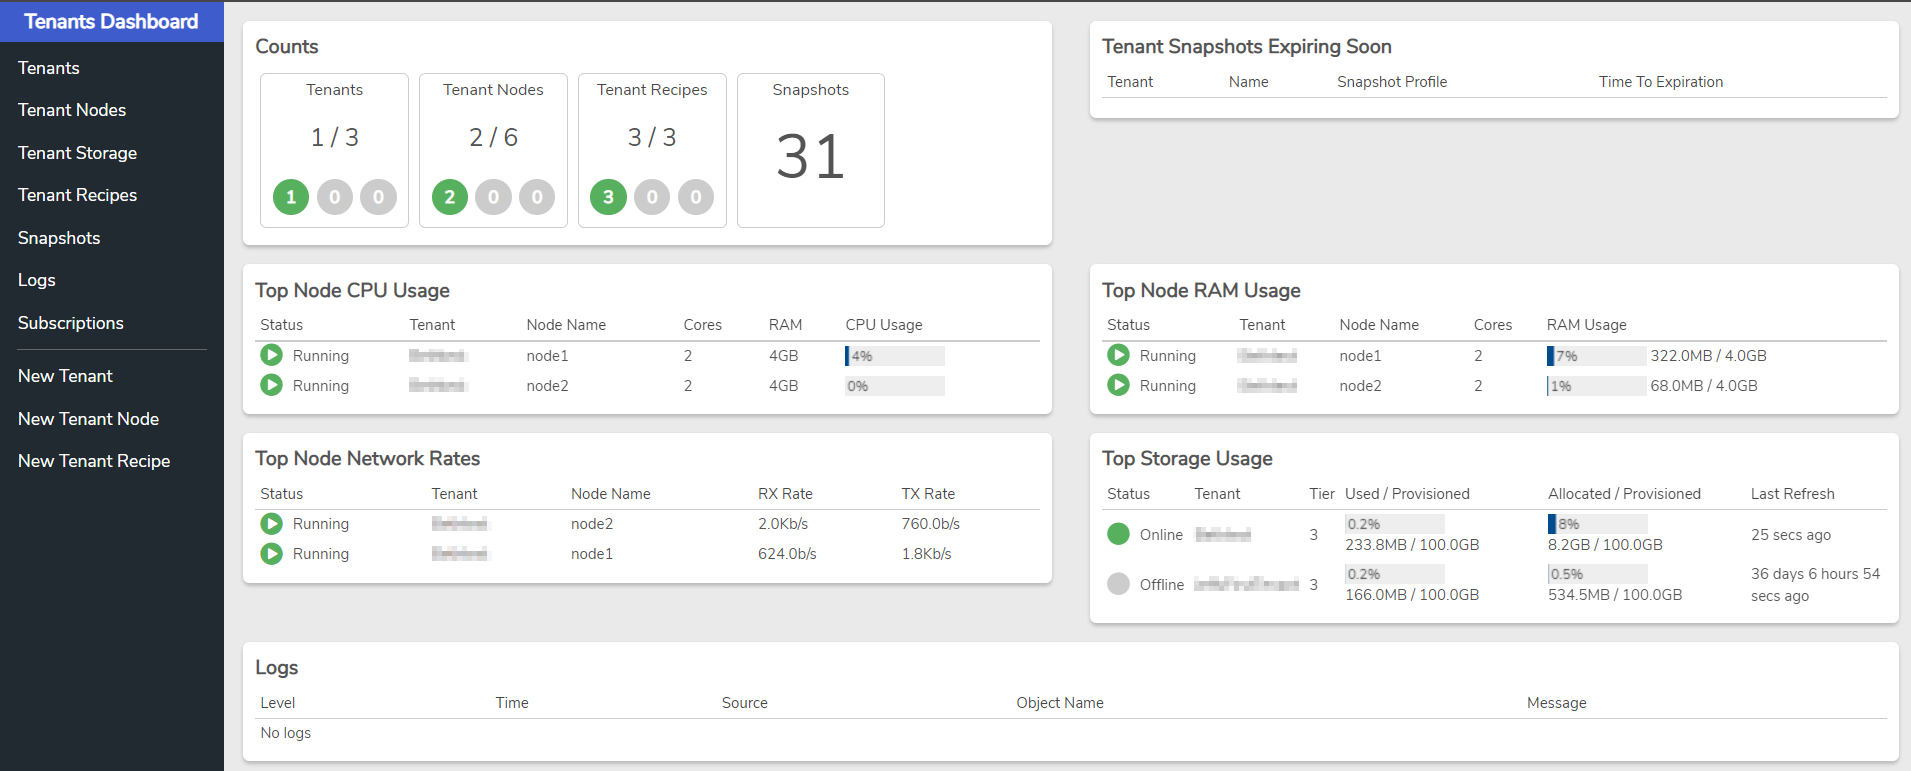
To access the All-Tenants Dashboard:
Click on Tenants from the Main Dashboard (Quick link or left menu).
Counts/Status Indicators
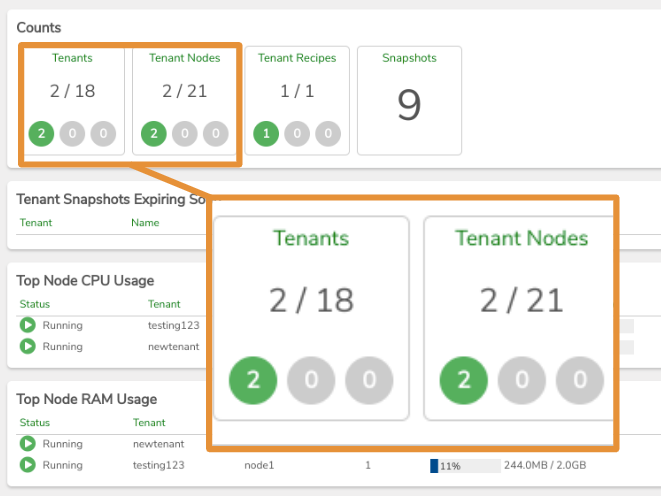
In the top left of the Tenants Dashboard, the Counts and status indicators will show the number of Tenants powered on/total number of Tenants; and the number of Tenant Nodes powered on/total number of Tenant Nodes. In the following example, there are 2 Tenants powered on out of a total of 18 existing Tenants. 2 of the 21 Tenant Nodes are powered on.
Tenants Usage
This view provides a quick view of the top usage among your Tenants, across CPU, RAM, Storage, and Network. Each list entry is also a link to that Tenant’s Dashboard to quickly access more detailed information about the particular Tenant.

Individual Tenant Dashboard
Each Network has its own Dashboard to show summary information about that particular Network, as well as links to more detailed information.
To access a particular Tenant’s Dashboard:
- From the (All) Tenants Dashboard, click Tenants.
- A list of all Tenants appears.
- Double-click on the desired Tenant.
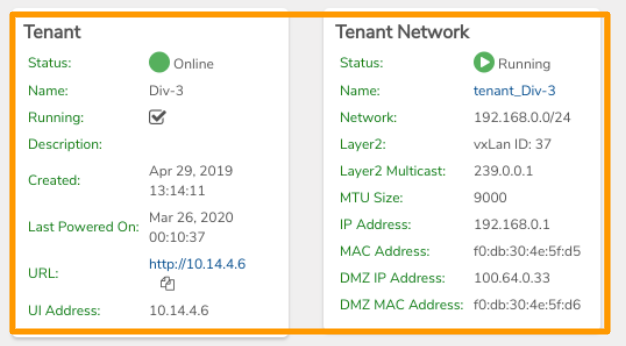
The individual Tenant’s Dashboard displays configuration information and network information.
Counts/Provisioned Resources
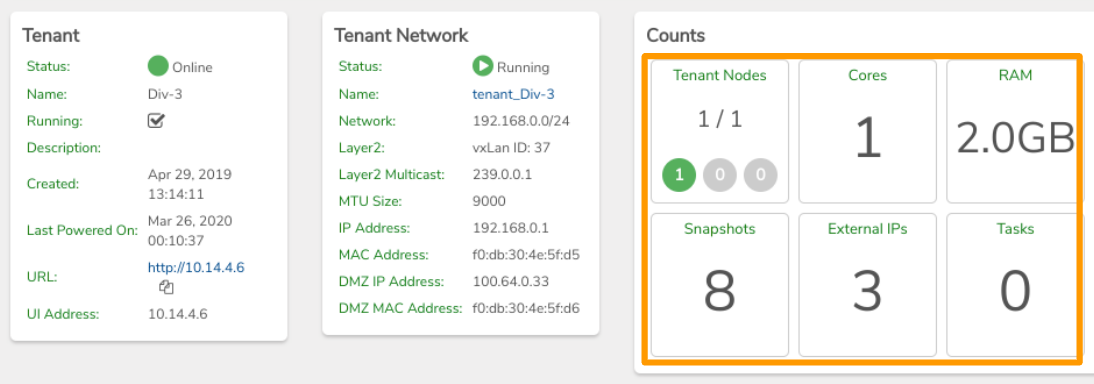
The Counts section gives a quick view of Tenant Nodes, resources provisioned to the Tenant, and the current number of snapshots available.
Storage Used/Provisioned/Allocated
Tenant Storage numbers can be confusing. The Storage section shows you all the Storage Tiers and Usage statistics. Here is an explanation for each:
- Storage Used - This is the current actual used storage across the entire storage tier. This includes storage used for the entire tenant. This number is the deduplicated amount used. The actual amount used can be much higher if you export outside of VergeOS.
- Storage Provisioned - Provisioned storage is the amount of storage that was provisioned when creating this tier. You can use more than the provisioned amount as long as the host has enough storage available. Caution should be used as you do not ever want to run out of storage at the host level.
- Storage Allocated - This is the amount of storage Allocated to the tenant and all of its workloads. For example, when creating VMs this is the total size of the drives. This also includes the allocated storage in your snapshots as well.
In general, you should always Provision more storage than Used or even Allocated.

Usage
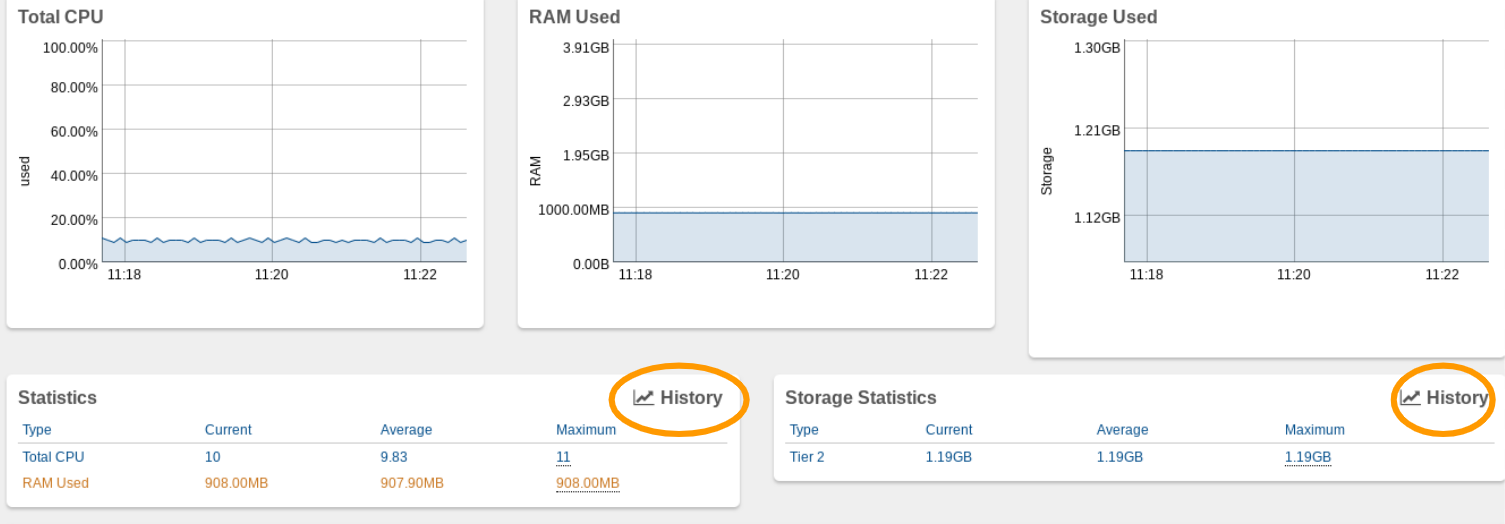
CPU, RAM, and Storage usage for the Tenant is provided in graph form (5-minute intervals) as well as statistic listings for the current 5-second “heartbeat”, with statistics information saved for the 5-minute intervals (corresponding to standard 95th percentile standards for billing). History links allow you to gather usage information for specific periods.
Logs
The most recent log entries will show on the Dashboard screen. Errors are highlighted in Red for easy recognition. Click the --View More-- link at the bottom to view further back in the logs.
¶ Subscriptions
Subscriptions can provide you with both regularly scheduled reports and on-demand alerts when errors, warnings, or specified changes occur, or if configured thresholds are reached. Instructions for a few typical Tenant-related subscriptions follow. For more information regarding Subscriptions, consult contact VergeIO Support for assistance.
All Tenants
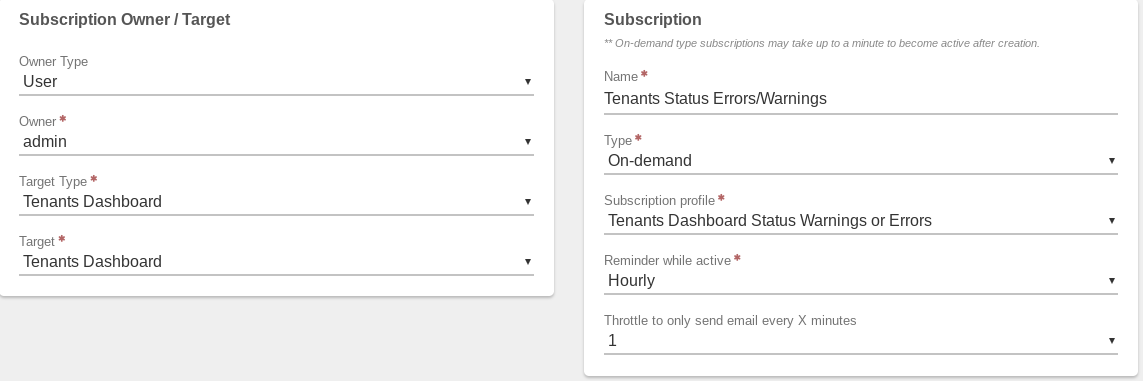
To Create a Subscription to Receive Alerts for Status Errors or Warnings related to Tenants:
- From the Tenants Dashboard, click Subscriptions on the left menu.
- Click New.
- Select User Type (User or Group).
- Select Owner (specific User/Group).
- The Target Type and Type fields are already populated as needed since Subscriptions was selected from the Tenants Dashboard.
- Enter a Name for the Subscription. The name you enter will appear in the email message sent.
- In the Subscription Type, select On-demand.
- In the Subscription profile, select Tenants Dashboard Status Warnings or Errors.
- Reminder while active and Throttle to.. fields can be configured to control the frequency of alerts.
To Create a Daily Subscription with a Summary of all Tenants (Tenants Dashboard):
- From the Tenants Dashboard, click Subscriptions on the left menu.
- Click New.
- Select User Type (User or Group).
- Select Owner (specific User/Group).
- The Target Type and Type fields are already populated as needed since Subscriptions was selected from the Tenants Dashboard.
- Enter a Name for the Subscription.
- In the Subscription Type, select Scheduled.
- In Subscription profile, select Tenants Dashboard.
- In the Frequency field, select Daily.
- Select Hour and Minute fields for desired time.
- Click Submit.
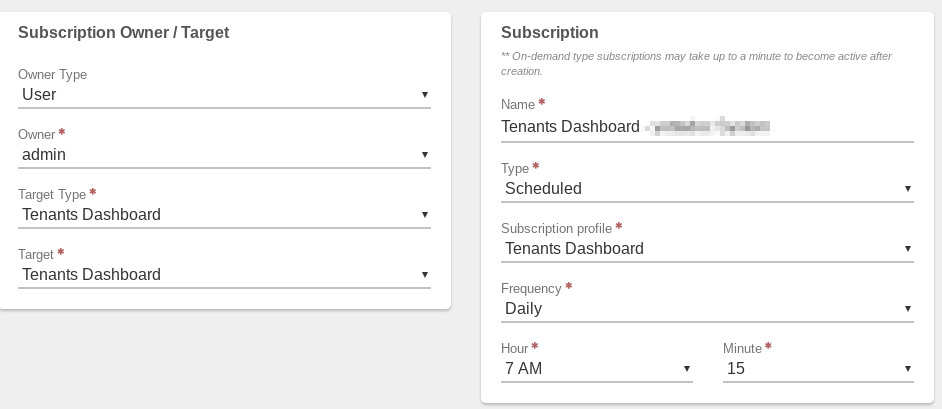
The following screenshot shows a Daily Subscription configured to send each day at 7:15 AM.
Individual Tenant
To Create a Weekly Subscription with a Summary of an Individual Tenant (individual Tenant Dashboard):
- From the particular Tenant Dashboard, click Subscriptions on the left menu.
- Click New.
- Select User Type (User or Group).
- Select Owner (specific User/Group).
- The Target Type and Type fields are already populated as needed since Subscriptions was selected from the desired Tenant Dashboard.
- Enter a Name for the Subscription.
- In the Subscription Type, select Scheduled.
- In the Subscription profile, select Tenants Dashboard.
- In the Frequency field, select Weekly.
- Select the desired Day of Week.
- Select Hour and Minute fields for desired time.
- Click Submit.
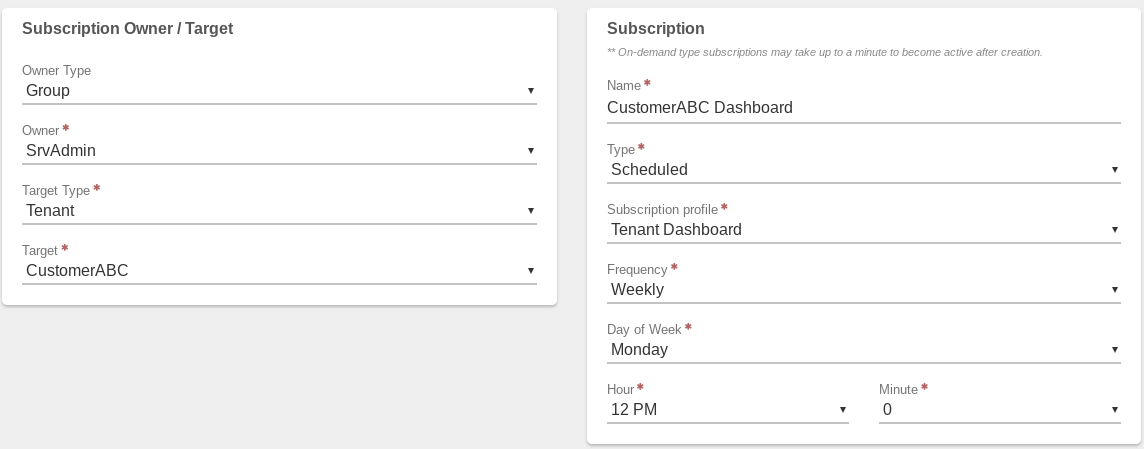
The following screenshot shows a Subscription configured to receive a weekly Dashboard report for the “CustomerABC” Tenant, every Monday at 12:00 PM. The Subscription is configured to go to the “SrvAdmin” Group.
Need more Help? Email [email protected] or call us at (855) 855-8300