¶ Using Network Dashboards
Network Dashboards provide a wealth of helpful information: data that can assist to monitor, tune, and troubleshoot networks in your system. They provide at-a-glance information and allow many clickable areas for “drilling down” to access more specific information where needed. There is a Networks Dashboard that displays summary information for all your Networks and links to more detailed information, such as the Dashboard for any individual Network.
¶ The Networks Dashboard (summary info for all Networks)
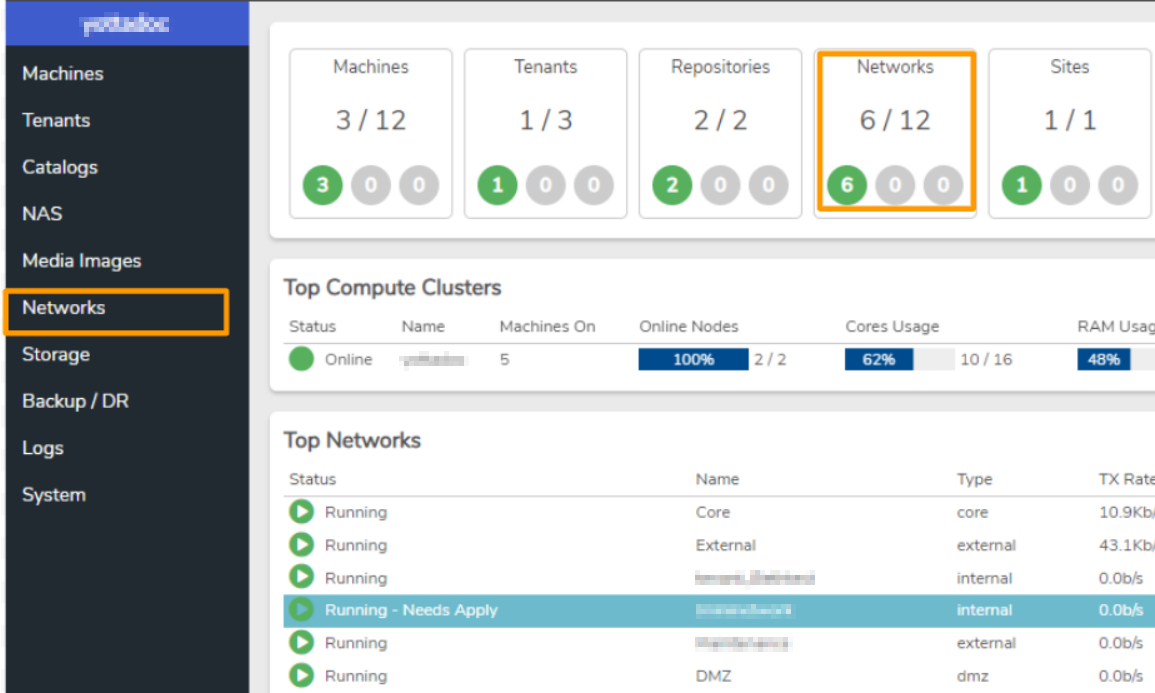
The Networks Dashboard contains summary information for all the networks in the system.
To access the Networks Dashboard:
Click on Networks from the Main Dashboard (quick-link or left menu.)
¶ Counts / Quick-Links
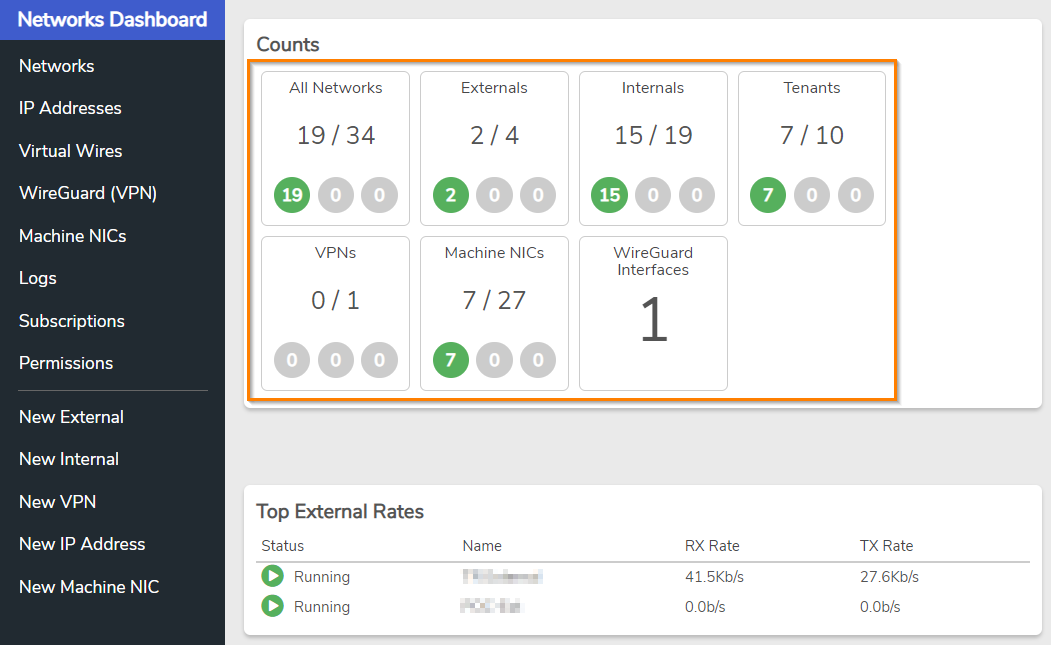
The Counts section shows a quick summary of your different types of networks as well as all Machine NICs. Each box shows the count / status for the associated list and provides a quick-link to access the corresponding list, where a specific network / NIC can be selected to view more detailed information.
¶ Status indicators
- Green - No errors or warnings
- Yellow - Warnings
- Red - Errors
In the above screenshot, no Networks or NICs have errors or warnings, so all status indicators are green. When red or yellow indicators are present this indicates there are errors or warnings; you can click to drill down and find more information about the issue.
¶ Top Stats
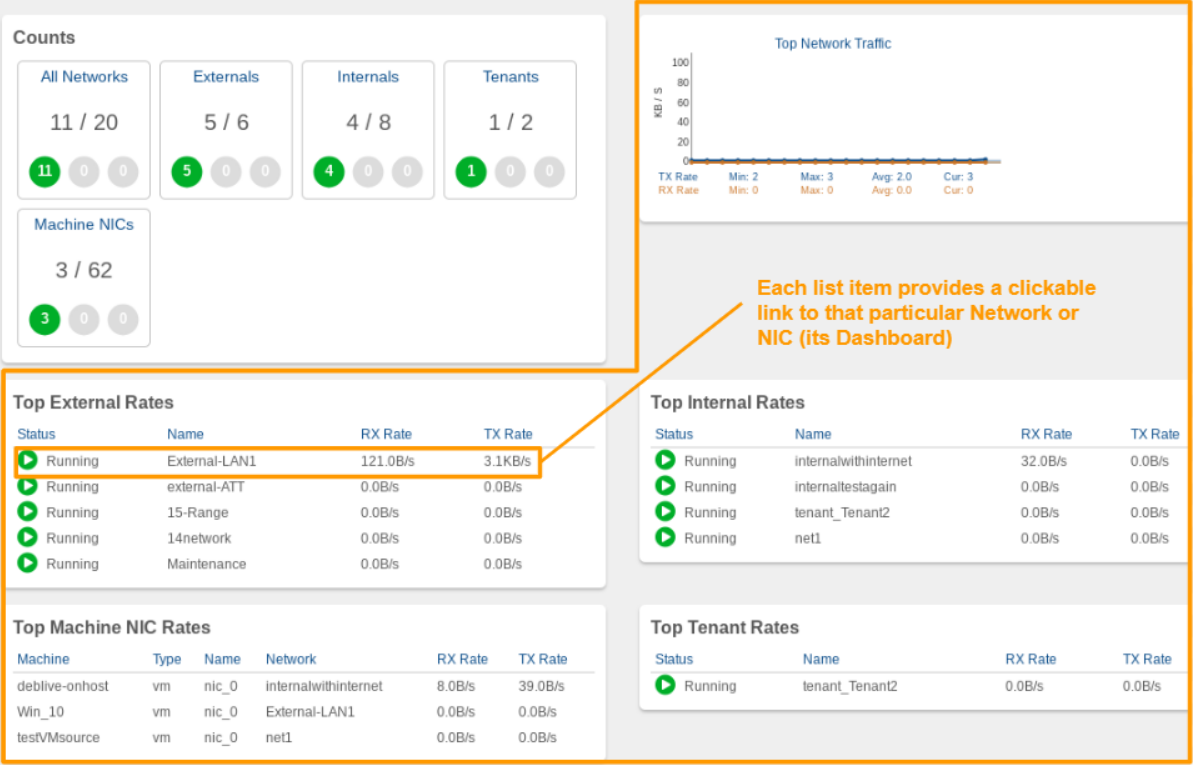
The Overview Networks Dashboard also displays real-time statistical information to give a current view of top network utilization. This gives a summary of highest transfer/receive rates broken out for: External, Internal, and Tenant Networks and VM NICs.
Each Network/NIC list entry:
- Reflects current status
- Is a clickable link to that Network / NIC
¶ Logs
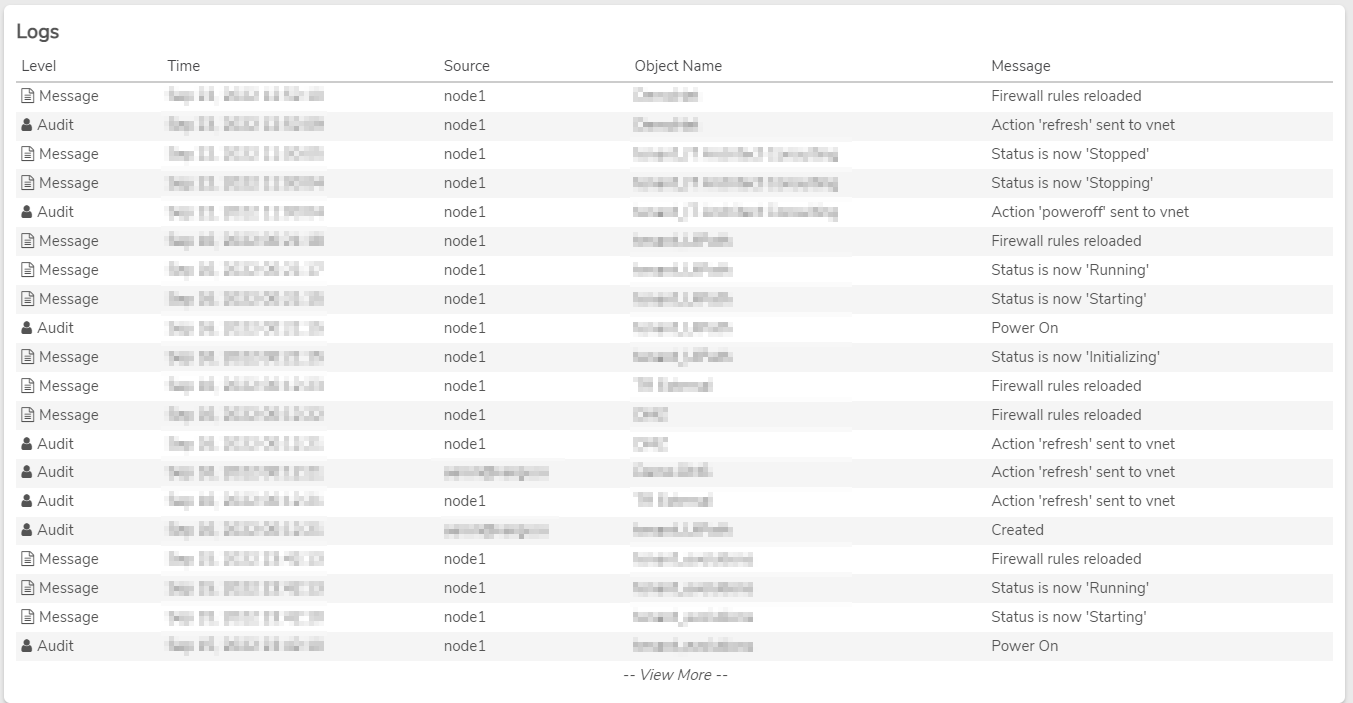
The logs section will show the most recent log entries for all your VergeIO Networks. Error entries are highlighted in red. Scroll down to view all the log entries on the first page. To view further back in network logs, click anywhere in the logs window.
¶ Individual Network Dashboard
Each individual Network has its own Dashboard to show summary information about that particular Network (as well as links to more detailed information).
¶ To Access an individual Network Dashboard:
-
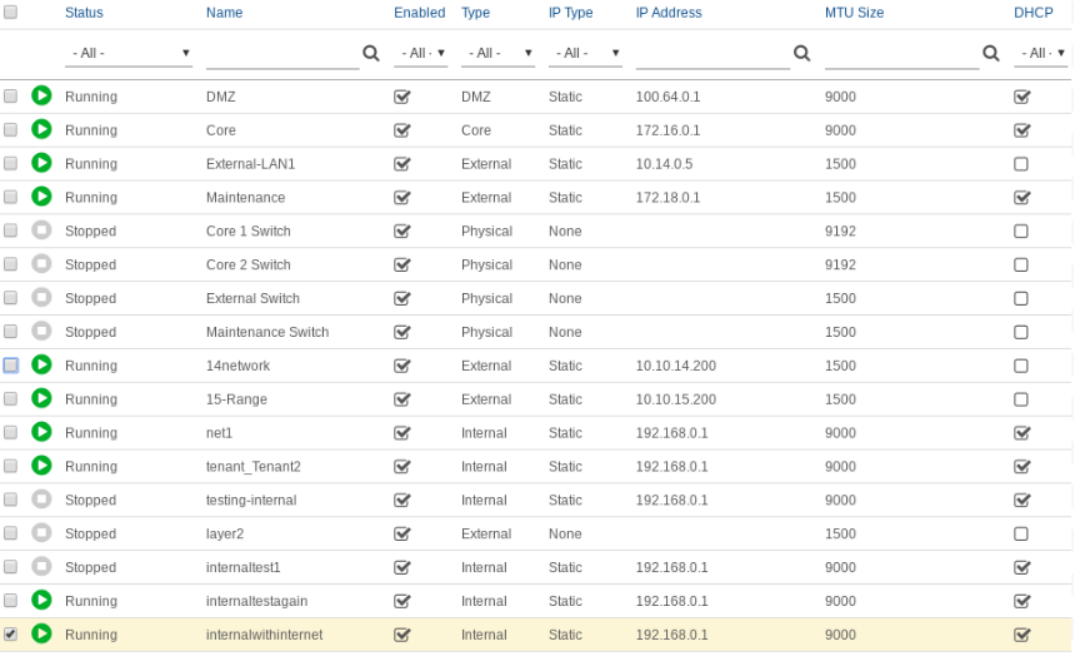
From the Networks Dashboard, click on one of the Count Quick-links, to see a listing of the corresponding Networks:
- Externals
- Internals
- Tenants
- All Networks
-
From the listing, double-click on the desired Network.
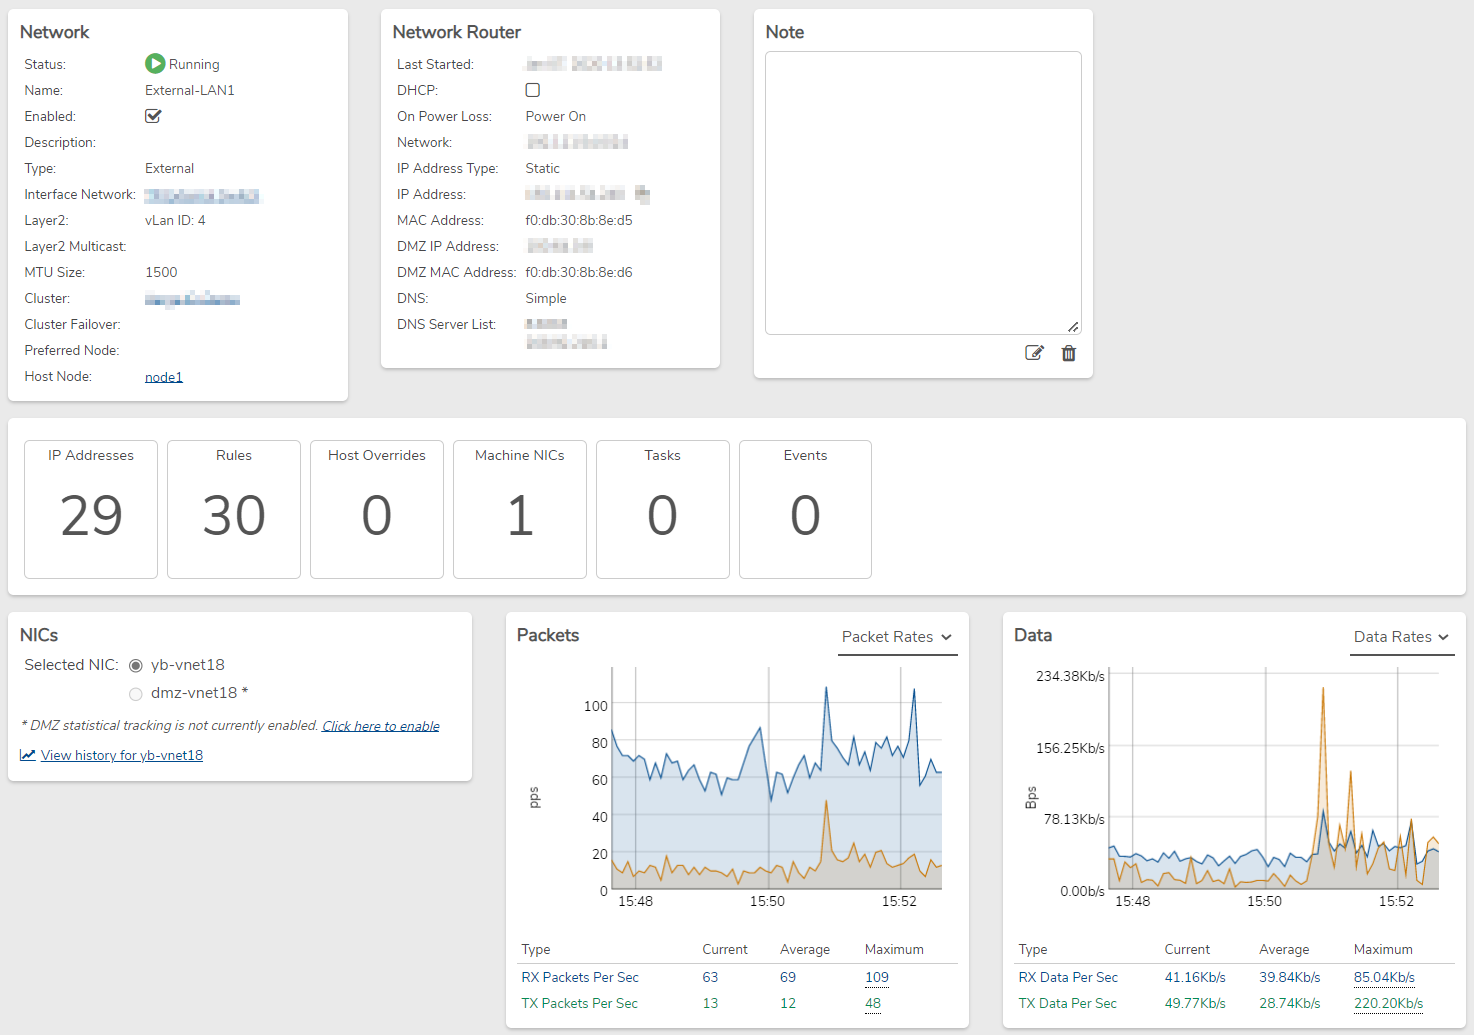
The following screenshot shows an example of an Individual Network (“External-LAN1”) Dashboard. Network and Routing (if applicable) information displays as well as current transfer rate data.
Counts quick-links provide a link to view detailed data for IP Addresses, Rules, DNS, NICs, etc. There are also links to view the primary and Failover Cluster as well as Host Node and Preferred Node defined for the Network.
¶ To see more granular detail on graphs:
- Click and drag a subset of the graph to see more detail for that selected timeframe.
- Double-click to back out to the original detail level.
¶ Statistics and History
Network Statistics are collected in 5 second “heartbeat” intervals, with sums / averages / maxes processed and stored for each 5 minute interval, corresponding to standard 95th percentile standards.
Click the History Link on the left menu to see history statistics for network traffic. A specific time period can be selected to view the time period desired (week, month, or custom- with from / to specific dates)
Need more Help? Email [email protected] or call us at (855) 855-8300