¶ Reasons for Unexpected / Unexplained vSAN Growth
There are several reasons for the vSAN to start growing at a rate faster than anticipated. Following this article, administrators should first determine when the unexplained growth happened (Review vSAN Tiers for growth history) and then review possible areas for unexpected growth (Possible Reasons for Storage Increase).
Review vSAN Tiers for growth history
The best way to isolate unexplained growth is to narrow down when growth increased, exponentially. Using the following steps, administrators can review storage growth. With this, they can visualize normal growth from daily operations versus spikes in growth which are typically unexpected.
Navigate to the vSAN Tiers from the Main Dashboard. If vSAN Tiers is not present on the dashboard, then this environment is a tenant of a parent system. The vSAN tier needs to be examined at the parent system.
Open the vSAN Tier with unexpected growth (example, vSAN Tier 0).
On the left navigation menu click on History.
A new menu system will appear showing history in various graphs, modify the Filter period to isolate if any growth is noted on this tier.
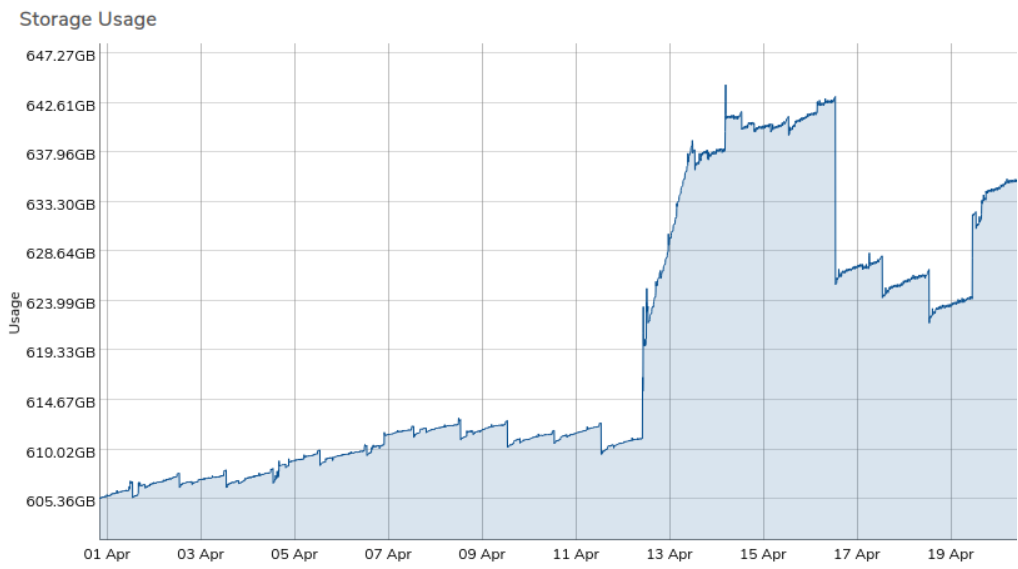
It's recommended to start with a custom filter of 1 day, and review the Storage Usage graph.
Things to note:
If every hour there is a dip and then a spike, or possibly once a day, then this is most likely the result of snapshots falling out of retention as normal (old ones expiring and new ones are created). If found, note if the total storage consumed at the start of the day is nearly equivalent to the end of the day. If so, expand the customer filter to a week.
If observing a week, note if the total storage consumed on this tier at the start of the week, relative to the total storage consumed at the end of the week. If for example, the growth is roughly 10%, then change the time filter to a week prior. Does the growth percentage week after week seem to fairly consistent? If so, this represents an average of your weekly growth (change) rate. This percentage can help a system administrator plan for future hardware expansion.
Lastly, filter on the current month and note if there are any sudden spikes in storage consumption on the Storage Usage Graph. This will likely represent when unexpected storage was consumed by the system. In the below example, between April 11th and April 13th, there was a 30GB increase in storage. This suggests a time frame to focus on. You can click and drag a mouse over the time in question to zoom in to a more detailed time window. At any point you can hover the mouse cursor over the graph and specific date/time information will be displayed below the graph.

Possible Reasons for Storage increase
There are several areas of the VergeIO platform that leverage storage; the most common areas where customers have unexpected growth are listed below.
- Review Cloud Snapshots. Navigate from the Main Dashboard to System>Cloud Snapshots.
- Are any being held past the expected expiration time?
- Are there snapshots that do not have a Snapshot Profile set? If so, these were taken manually. Investigate when and why the snapshot was taken.
- Are there any snapshots set to Never Expire? Over time, this can end up consuming large amounts of data.
- Review Virtual Machines for machine-level snapshots
- Navigate to the Machines Dashboard. In the Count Box titled Snapshots contains a count of all the machine-level snapshots present in the system. Clicking on this box will list each virtual machine-level snapshot and the date/time when it was created. If any are present, review if they can be removed.
- Navigate to Machines>Virtual Machines. In the virtual Machine list view, sort on the column Snapshot Profile. any VM with a value in this field is taking machine-level snapshots. These individual machine snapshots are also contained within the overall cloud snapshots which are also taken on a recurring schedule. If so, review if this is needed or if the individual machine snapshots can be removed.
- Review VMWare Backup jobs for long retention periods
- Navigate to Backup/DR>VMware Services. Review each configured VMWare Service instance for individual Backup Job history.
- On the left navigation menu, click on Backup Jobs to review each specific instance of a backup of a remote VMWare system. Note the expiration date under the Expires column. Review each backup job to determine if the backup can be removed.
- Review Media Images for any recently added files
- Navigate to Media Images. Sort by Modified. Review if the time frame of the unexplained growth matches any upload dates/times for Media Images.
- Review if any media images, especially other hypervisor image formats (for example .ova or .vhdx) can be removed from the system.
- Review if there are any Incoming Site Syncs
- Navigate to Backup/DR>Incoming Syncs. If any are present, open the dashboard of each Incoming sync and review the number represented in the Received Snapshots count box. This is the current number of remote snapshots. In this scenario, investigate the Source (Origin) site to determine if there was an increase in storage that matches the same time frame in question.
- Review each tenant for unexpected Used Storage increases
- Navigate to Tenants>Tenants>Each tenant dashboard
- Review the Total Storage Used at each tenant by clicking on History in the left navigation menu. Follow the same process listed above for reviewing growth history.
- If unexplained growth is found, administrators will need to search inside the tenant for all of the same possible reasons of storage increase (listed above), and possibly inside sub-tenants, if any are present.
Need more Help? Email [email protected] or call us at (855) 855-8300